Running Telegraf on a RaspberryPi driven Kubernetes cluster
After I got my Kubernetes cluster up and running on my 4 Raspberry Pi’s, I was wondering how to get metrics like CPU, MEM, and disk consumption from those machines. Since I am already familiar with telegraf, I choose it.
So the first task was to find a telgraf container built for arm: arm32v7/telegraf
It however turned out I also want to monitor the temperature of my PI’s - it’s easy to read the temperature:
/opt/vc/bin/vcgencmd measure_temp
However, the normal telegraf docker image does not contain the vcgencmd binary - so I had to create my own
FROM arm32v7/telegraf

ADD qemu-arm-static /usr/bin
ADD raspi.list /etc/apt/sources.list.d/raspi.list
RUN wget -qO - http://archive.raspberrypi.org/debian/raspberrypi.gpg.key | apt-key add -

# update and install the raspberry pi userland tools
RUN apt-get update && apt-get -y dist-upgrade && \
    apt-get install -y libraspberrypi-bin && \
    rm -rf /var/lib/apt/lists/*
You might wonder about the “ADD qemu-arm-static /usr/bin” - I will dedicate a special post about how to build arm docker images on x86.
With the image build hub.docker.com/r/sebd/telegraf-rpi, I was able to configure the exec input plugin like this:
[[inputs.exec]]
   commands = [ "/opt/vc/bin/vcgencmd measure_temp" ]
   name_override = "cpu_temperature"
   data_format = "grok"
   grok_patterns = ["%{NUMBER:value:float}"]
the full ConfigMap looks like this:
apiVersion: v1
kind: ConfigMap
metadata:
  namespace: default
  name: telegraf-ds
data:
  telegraf.conf: |+
    [agent]
      interval = "60s"
      round_interval = true
      metric_batch_size = 1000
      metric_buffer_limit = 10000
      collection_jitter = "0s"
      flush_interval = "60s"
      flush_jitter = "0s"
      precision = ""
      debug = true
      quiet = false
      logfile = ""
      hostname = "$HOSTNAME"
      omit_hostname = false
    [[outputs.influxdb]]
      urls = ["http://influxdb.somewhere:8086"]
      database = "telegraf"
      retention_policy = "default"
      write_consistency = "any"
      timeout = "5s"
      username = "xxxxxxxx"
      password = "xxxxxxxx"
      user_agent = "telegraf"
      insecure_skip_verify = false
    [[inputs.cpu]]
      percpu = true
      totalcpu = true
      collect_cpu_time = false
    [[inputs.disk]]
      ignore_fs = ["tmpfs", "devtmpfs"]
    [[inputs.diskio]]
    [[inputs.docker]]
      endpoint = "unix:///var/run/docker.sock"
      container_names = []
      timeout = "5s"
      perdevice = true
      total = false
    [[inputs.kernel]]
    [[inputs.mem]]
    [[inputs.processes]]
    [[inputs.system]]
    [[inputs.exec]]
      commands = [ "/opt/vc/bin/vcgencmd measure_temp" ]
      name_override = "cpu_temperature"
      data_format = "grok"
      grok_patterns = ["%{NUMBER:value:float}"]
To let it run on all the nodes in my kubernetes cluster, I created a DaemonSet with a special toleration (to also have it run on the k8s master)
apiVersion: apps/v1
kind: DaemonSet
metadata:
  namespace: default
  name: telegraf-ds
spec:
  selector:
    matchLabels:
      app: telegraf
      type: ds
  template:
    metadata:
      labels:
        app: telegraf
        type: ds
    spec:
      tolerations:
        - key: node-role.kubernetes.io/master
          effect: NoSchedule
      containers:
      - name: telegraf
        image: sebd/telegraf-rpi
        securityContext:
          privileged: true
        env:
        - name: HOSTNAME
          valueFrom:
            fieldRef:
              fieldPath: spec.nodeName
        - name: "HOST_PROC"
          value: "/rootfs/proc"
        - name: "HOST_SYS"
          value: "/rootfs/sys"
        volumeMounts:
        - name: dev-vchiq
          mountPath: /dev/vchiq
        - name: sys
          mountPath: /rootfs/sys
          readOnly: true
        - name: proc
          mountPath: /rootfs/proc
          readOnly: true
        - name: docker-socket
          mountPath: /var/run/docker.sock
        - name: varrunutmp
          mountPath: /var/run/utmp
          readOnly: true
        - name: varlog
          mountPath: /var/log
          readOnly: true
        - name: varlibdockercontainers
          mountPath: /var/lib/docker/containers
          readOnly: true
        - name: config
          mountPath: /etc/telegraf
          readOnly: true
      volumes:
      - name: dev-vchiq
        hostPath:
          path: /dev/vchiq
      - name: sys
        hostPath:
          path: /sys
      - name: docker-socket
        hostPath:
          path: /var/run/docker.sock
      - name: proc
        hostPath:
          path: /proc
      - name: varrunutmp
        hostPath:
          path: /var/run/utmp
      - name: varlog
        hostPath:
          path: /var/log
      - name: varlibdockercontainers
        hostPath:
          path: /var/lib/docker/containers
      - name: config
        configMap:
          name: telegraf-ds
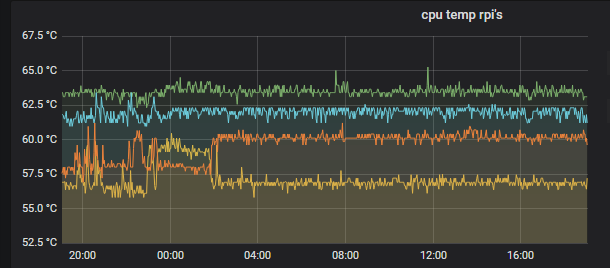
and voila it started to export all the metrics into my influx db (yes - the hottest one is the master)